
Code with SAP Labs India - Discover, Design, Deliver
6701 Registered
Allowed team size:
1 - 4
6701 Registered
Allowed team size:
1 - 4
Winners are announced.
POC Submission
Online
starts on:
Mar 16, 2021, 03:30 AM ()
ends on:
May 16, 2021, 06:25 PM ()
Winners
First Prize
Second Prize
Use-case based Interpretation of Machine Learning Models using Explainable AI
Theme:
Bringing Explainable AI into …
Third Prize
Smart Infrastructure
Intelligent Infrastructure Maintenance
Overview: Norwegian Public Roads Administration (NPRA) is a Norwegian government agency responsible for national and county public roads in Norway. Amongst the other responsibilities NPRA is also responsible for the maintenance of the roads and bridges in the country. Several prominent bridges are ageing and need continuous attention. Traditionally NPRA has based their maintenance on preventive methods and time scheduled inspections. With increasing needs for maintenance NPRA need to address which bridges to maintain in a more efficient and optimized way compared to the traditional methods.
NPRA and SAP are working together on a real-time monitoring system for Stavå bridge. SAP in collaboration with NPRA has introduced a digital twin solution to enable the real-time monitoring of the bridge. Real-time information is gathered using several sensors placed on the various parts of the bridge and sent to the SAP system for monitoring. With this information NPRA can understand the bridge maintenance requirements and patterns.
The challenge of measuring and monitoring bridge behaviour and analyzing structural deterioration over time was solved mainly using several sensors placed at several key positions on the bridge. The inputs from these are processed and analyzed in order to understand the behaviour of the bridge. The main sensors whose data is being utilized for the tasks in this Hackathon are:
- There are 20 sensors of the type accelerometers placed on the bridge.
- Each accelerometer provides 3 channels of data measuring acceleration in axes orthogonal to each other [let’s call these orthogonal axes a, b and c].
- One air temperature sensor located near the bridge.
Note that all sensors do not have the same orientation in space and may be rotated relative to each other in both the horizontal and vertical plane. Channels 1 (axis a), 2 (axis b) and 3 (axis c) may thus represent different directions for different sensors, i.e. point in different directions, that could even be opposite to each other. Additionally, the ‘Frost’ data in the dataset provided indicates the temperature sensor being present near the bridge.
The accelerometers deliver data in 64 Hz, while temperature measurements are updated every 10 minutes. Please take a look at the short visualization video-clip showing raw values from accelerometers.
Tasks:
1: Data Compression
The corresponding temperature data will also be provided, and can be used, if the candidate wants. The temperature readings will not be subject to evaluation.
Example: Some example solution strategies:
- Dimensionality Reduction Techniques
- Auto-Encoders
- Algorithms to predict the value of some sensors(Y) using the rest of the sensors(X). Thus, in the encoding part, the dimensions of Y could be stripped off and in decode, they could be predicted.
2: Sensor Network Robustness
Naming Conventions:
For sensor An,
- The values for channels a, b, c are denoted by An_a, An_b, An_c
- the vector length is calculated using Pythagoras (vector length equation) and is denoted by An,
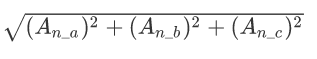
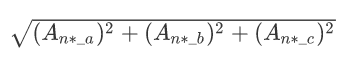
The predicted a,b,c values are denoted by An*_a, An*_b, An*_c
The predicted vector length is calculated using Pythagoras (in the form vector length equation) and is denoted by An*
Bias Removal:
For all the calculations, in-order to avoid the issues and biases that could be caused due to noise or external effects such as temperature, a pre-processing is applied. For this, we divide the day into 5 minute intervals, and the average value of vector length is calculated for these intervals [For the scope of this hackathon, these are fixed windows and not sliding windows]. For all the sensors, the vector length An at time t, is then calculated as the difference of the value of the vector length An at time t, and the average value of the vector length in the 5 minute interval.
An (corrected) at time t = An at time t – Average value of An in the 5 minute time interval
Technical Evaluation Criteria
Challenge 1:
Metric 1: The data loss would be measured between the sum of differences in the square of the original vector length (average taken out as described above) and sum of square of the encoded-decoded value for all sensors. This difference should be within 10% of the original sum of squares (of An). These metrics will be computed on the validation dataset. The higher the reduction in dimension while ensuring 90% data, the better.
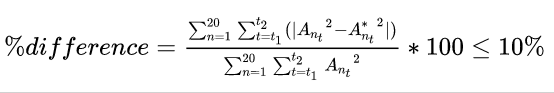
where Ant is the original vector length of sensor An at time t
, A*nt is the vector length after encoding-decoding of sensor An at time t
, n is the index of sensors from 1 to 20
, t1 is the beginning time and t2 is the end time
In addition to the metric, the following criterions can also be assessed to select the winner:
- Data retention, that is among two approaches with similar level of dimension reduction, the one with higher data retention is better.
- Generalizability of the approach, can it be used for other type of sensors.
- Size of the model (if used), smaller the better.
- Speed
Challenge 2:
Metric 1: RMSE across each of the sensors. RMSE will not be independently calculated across dimensions, but the RMSE between the original vector length and predicted vector length will be used. That is RMSE will be calculated between vector length An and An*. Before we do this calculation, the bias removal strategy specified above will be applied to both An and An*.These metrics will be computed on the validation dataset, the candidate with the lower total RMSE wins.
In addition to the metric, the following criterions can also be assessed to select the winner:
- Generalizability
- Size of the model
- Speed
Data & resources:
Note: We have reserved an additional test data set in the same format as training data. Your data model & pipeline should be robust for validation testing.